Aytyapi Insights
Exploring the latest trends and updates in technology and lifestyle.
Big Data, Bigger Decisions: How Analytics is Changing the Game
Unlock the power of big data! Discover how analytics is revolutionizing decision-making in today's fast-paced world.
Understanding Big Data: Key Concepts and Significance in Today's World
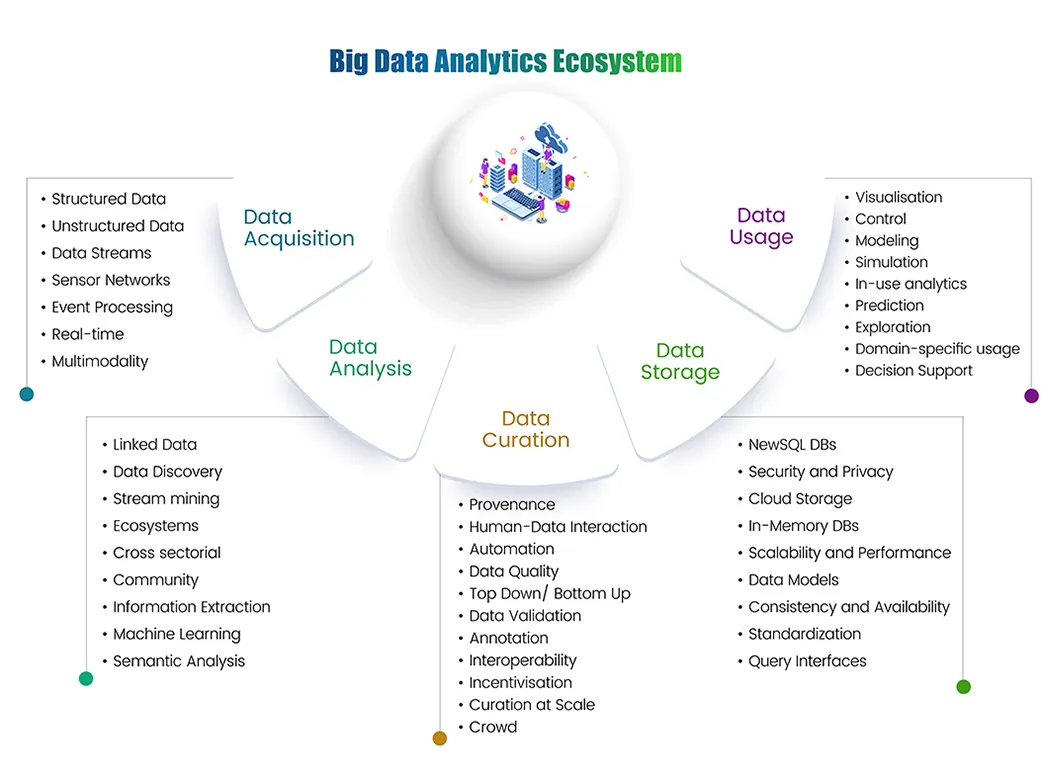
Big Data refers to the massive volumes of structured and unstructured data that inundate businesses on a daily basis. This data is so large and complex that traditional data processing software is inadequate to handle it effectively. Key concepts in Big Data include the 3 V's: Volume, Variety, and Velocity. Volume pertains to the sheer amount of data, Variety emphasizes the different types of data (such as text, images, and videos), and Velocity refers to the speed at which this data is generated and processed. Understanding these concepts is crucial for organizations aiming to harness the full potential of Big Data in today's data-driven landscape.
The significance of Big Data cannot be overstated, as it plays a pivotal role in enhancing decision-making processes across industries. By utilizing advanced analytics and machine learning algorithms, businesses can uncover patterns and insights from their data that were previously hidden. This enables organizations to improve customer experiences, optimize operations, and ultimately drive innovation. For instance, companies can leverage Big Data to personalize marketing strategies or predict market trends, thereby gaining a competitive edge. As more data becomes available, the ability to analyze and act upon it will only grow in importance.

How Predictive Analytics is Shaping Business Strategies
Predictive analytics is revolutionizing the way businesses approach their strategies by leveraging data to foresee future trends and customer behaviors. This approach utilizes historical data, statistical algorithms, and machine learning techniques to identify patterns and predict outcomes. For instance, companies can analyze past purchasing behaviors to anticipate future sales, enabling them to optimize inventory levels and reduce costs. As a result, businesses can make more informed decisions, enhancing their operational efficiency and overall profitability.
Furthermore, the integration of predictive analytics into business strategies allows for a more proactive stance in market engagement. Organizations can segment their customers more effectively, tailoring marketing campaigns to meet the specific needs and preferences of different audience groups. By employing predictive modeling, businesses can identify potential churn risks and implement targeted retention strategies, thereby improving customer loyalty. In today's competitive landscape, the ability to leverage predictive analytics not only enhances decision-making but also paves the way for innovation and growth.
The Role of Data Visualization in Effective Decision-Making
Data visualization plays a crucial role in effective decision-making by simplifying complex data into understandable visual formats. By converting raw data into graphic representations such as charts, graphs, and maps, organizations can identify trends, patterns, and correlations that might not be apparent in text-heavy reports. This clarity helps decision-makers to quickly grasp the implications of the data, facilitating faster and more informed choices. For instance, a business analyzing sales performance over time may use a line graph to clearly illustrate fluctuations, enabling the team to pinpoint seasonal trends and strategize accordingly.
Moreover, data visualization fosters collaboration and communication among stakeholders. When data is presented visually, it becomes more accessible to those who may not have a deep analytical background. This democratization of information ensures that all team members, regardless of their expertise, can engage in discussions about the data presented. In turn, this can lead to more comprehensive discussions and innovative solutions, as diverse perspectives are brought to the table. Ultimately, investing in quality data visualization tools and practices can empower teams to make decisions that are not only data-driven but also innovative and forward-thinking.